Survey Examines Public Charities Investment Reserves – See What 486 Organizations Had to Say
Guest Blog by Dennis Gogarty, CFP, AIF
Founder, Study on Nonprofit Investing (SONI)
President, Raffa Wealth Management, LLC
Now in its fourth year, the annual Study on Nonprofit Investing (SONI) polls public charities and nonprofits on various investment topics such as investment performance, portfolio
benchmarking,
and rebalancing policies. Raffa Wealth Management,
producer
of SONI, publishes the results in order to provide nonprofits with critical data they can use to benchmark their organization with their peers.
When it comes to investment reserves, it is common for public charities and other nonprofits to wonder “how much do other organizations target to keep in reserves“ and “how are those reserves invested?” The 2016 SONI survey seeks to answer these and other pressing questions relating to nonprofit financial practices.
Public Charity Participation
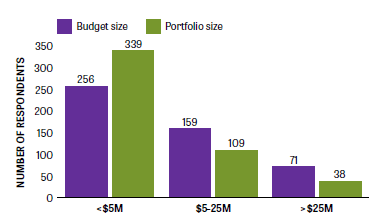
This year, 722 U.S.-based nonprofits participated in the SONI study, 486 of which identified as public charities. Of the public charities that participated, 50 percent identified as organizations that provide social services or community development. Roughly 20 percent identified as providing educational or religious services. Respondents were segmented into three buckets based on portfolio/budget size, as shown below.
Public Charity Investment Reserves
Survey participants were asked to disclose the minimum number of months that their organization aims to maintain in reserves. In this case, reserves were measured in terms of the total liquid cash assets as a portion of the annual operating budget. Respondents were bucketed into one of three cohorts based on annual budget size – less than $5 million, $5-$25 million, and greater than $25 million.
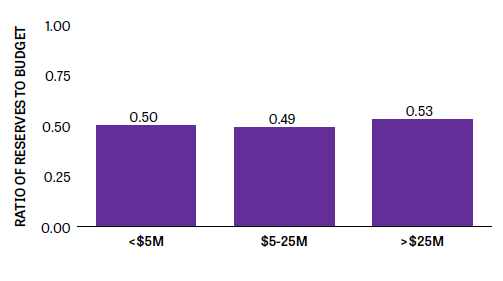
Across all budget size cohorts, public charities’ reserve to budget ratios teetered around 0.50. In other words, public charity respondents reported that their organization aspires to maintain approximately six months of their annual operating budget in cash assets.
Public Charity Segmentation
In order to assess how public charities segment their liquid cash assets, the survey asked participants to quantify the amount of assets held in the following four buckets:
1. Cash in checking
2. Excess operating cash
3. Short/intermediate term investments
4. Long term investments
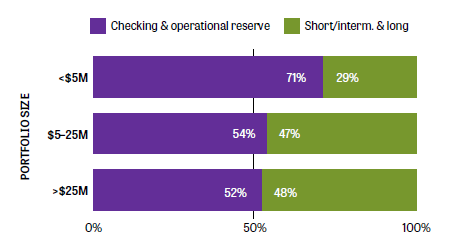
The first and last two buckets were grouped together to show the split among total liquid assets held in cash vs. those held in investments to support a longer term objective. The study found that of those public charities that participated, organizations with a portfolio size less than $5 million maintain roughly 71 percent of their liquid assets in cash and designate 29 percent to short, intermediate, and long-term investments. Larger organizations (those with a portfolio size between $5 and $25 million, as well as those with a portfolio size greater than $25 million) maintain almost a balanced split between cash and investments.
It is important to note, however, that all public charities are not created equal. Dennis Gogarty, co-founder of SONI and president of Raffa Wealth Management, states “public charities’ financial considerations are as unique as the mission statements that define them.” He adds, “charities and other nonprofits should use this data as a guide, as opposed to a hard-and-fast rule. We encourage nonprofit executives to consult with their board to further define the target amount and segmentation that works best for their organization.”
SONI is partnering with Maryland Nonprofits to offer an informative flash webinar titled
How
Do Your Public Charity’s Investments Measure Up? on Thursday, 10/20/16 at 12:00pm. Maryland Nonprofits members will be granted free access to the webinar.
To learn more about the 2016 SONI results or to register to participate in the 2017 survey (respondents receive results reports for free), visit www.npinvesting.org. Contact SONI@raffawealth.com with questions.
All survey and performance results have been compiled solely by Raffa Wealth Management based on information provided by survey respondents. Results have not been independently audited or verified. The views expressed herein are opinions reflecting the best professional judgment of Raffa Wealth Management, LLC. This report is for informational purposes only. Different types of investments involve varying degrees of risk, and there can be no assurance that the future performance of any specific investment or investment strategy made reference to directly or indirectly in this report will be profitable or be suitable for your nonprofit’s portfolio.
Information
contained in this article and the SONI reports are not personalized investment advice from Raffa Wealth Management, LLC.
![]()